Highlights
| (Millions pesos at December 31 of each year*) | 2016 | 2017 | 2018 | Var% 2018-2017 |
|---|---|---|---|---|
| INCOME | ||||
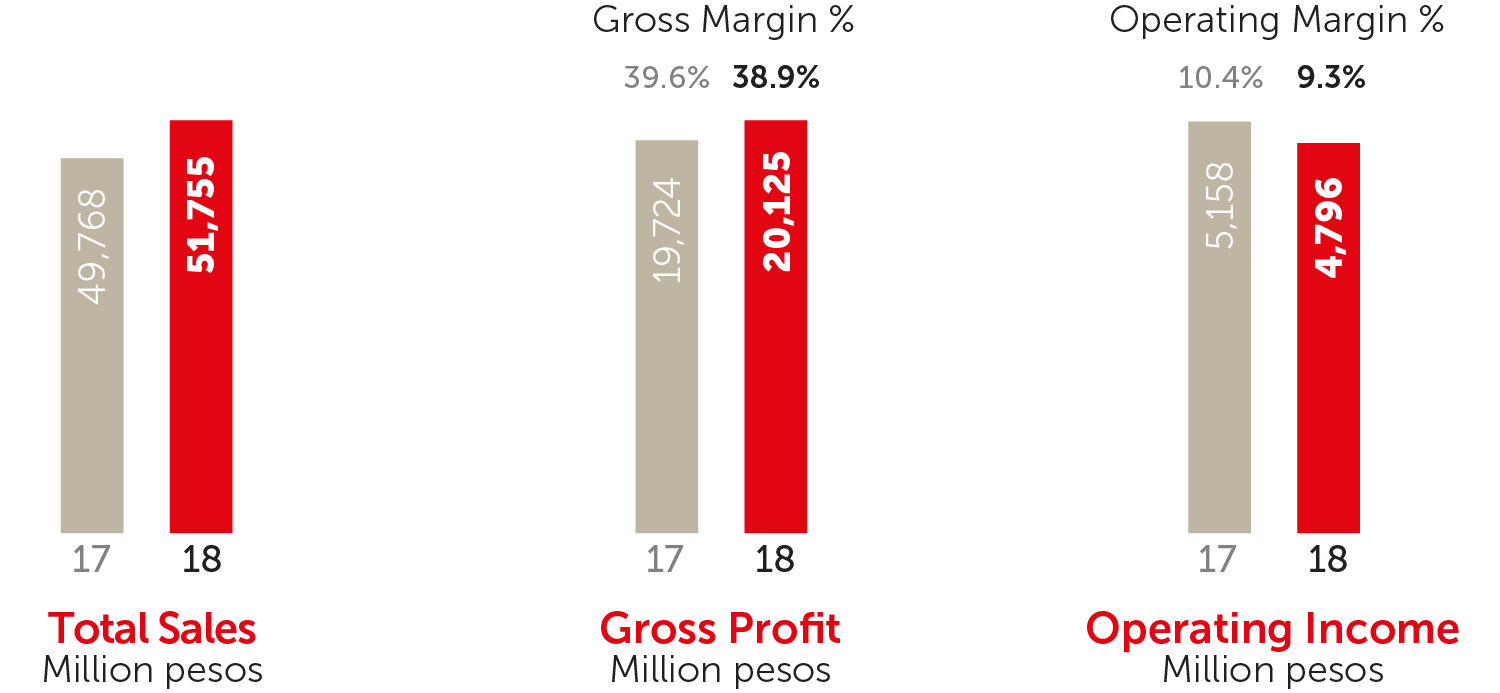
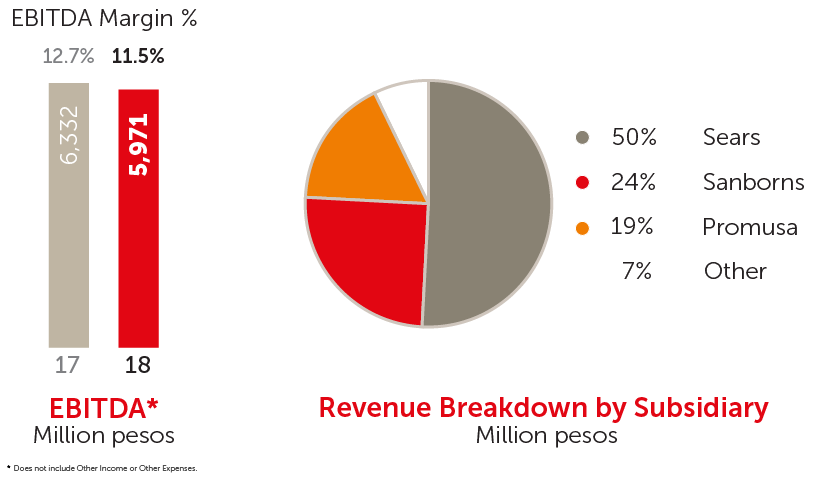
| Total Sales | 47,594 | 49,768 | 51,755 | 4.0% |
| Retail Sales | 44,411 | 46,159 | 47,961 | 3.9% |
| Credit Income | 3,183 | 3,609 | 3,794 | 5.1% |
| Gross Profit | 18,922 | 19,724 | 20,125 | 2.0% |
| Operating Income | 6,620 | 5,158 | 4,796 | -7.0% |
| Operating Margin | 13.9% | 10.4% | 9.3 | -1.1 pp |
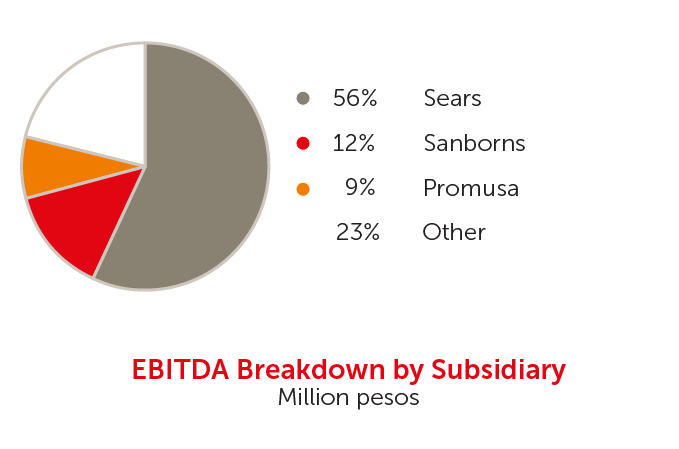
| EBITDA | 6,474 | 6,332 | 5,971 | -5.7% |
| EBITDA Margin | 13.6% | 12.7% | 11.5% | -1.2 pp |
| Controlling Participation in Net Income | 4,466 | 3,958 | 3,535 | -10.7% |
| Net Margin | 9.4% | 8.0% | 6.8% | -1.1 pp |
| BALANCE | ||||
| Total Assets | 45,185 | 47,888 | 50,382 | 5.2% |
| Total Liabilities | 14,234 | 15,368 | 16,589 | 7.9% |
| Consolidated Stockholders’ Equity | 30,952 | 32,520 | 33,793 | 3.9% |
| Capital Expenditures | 2,905 | 1,584 | 1,418 | -10.4% |
| Total Debt | 0 | 0 | 0 | NA |
| Net Debt | -1,714 | -1,925 | -2,478 | 28.7% |
| CREDIT | ||||
| Credit Portfolio | 12,009 | 12,891 | 12,920 | 0.2% |
| % Non-Performing Loans | 2.8% | 4.3% | 4.4 | 0.1 pp |
| Credit Cards issued | 3,672,865 | 3,941,514 | 4,156,035 | 5.4% |
| OTHER INDICATORS | ||||
| Net Debt/EBITDA | -0.26 | -0.30 | -0.41 | 36.5% |
| CapEx/Sales | 6.1% | 3.2% | 2.7% | -0.4 pp |
| Total Sales Area (Sqm) | 1,186,230 | 1,207,060 | 1,235,822 | 2.4% |
| Compounded Average Share Outstanding (thousand) | 2,304,320 | 2,296,548 | 2,264,891 | -1.4% |
| Earnings per Share** | 1.94 | 1.74 | 1.56 | -10.1% |
| Closing year stock price*** | 21.69 | 19.60 | 17.70 | -9.7% |
*Except outstanding shares, earnings per share and number of credit cards.
** Controlling Participation in Net Income divided by the compounded average number of outstanding shares.
***Started quoting in the MSE on February 8th, 2013.
EBITDA: Income before income taxes plus depreciation and amortization, interest expense, impairment of machinery and equipment and exploration expenses, and effect on valuation of derivative financial instruments, less interest income, net foreign exchange gain, surplus from appraisals of shopping centers and equity in earnings of associated companies and joint ventures. Review EBITDA conciliation in Note 26 of the Financial Statements.
pp: Variation in percentage points.